This week I ran into a string of problems on an Azure VM hosting a RAG (Retrieval-Augmented Generation) application, and fixing them taught me more about how virtual machines actually behave under pressure than any tutorial would have. Here's what happened, explained from the basics up, in case it saves someone else the same few hours of confusion.
What is a VM, really?
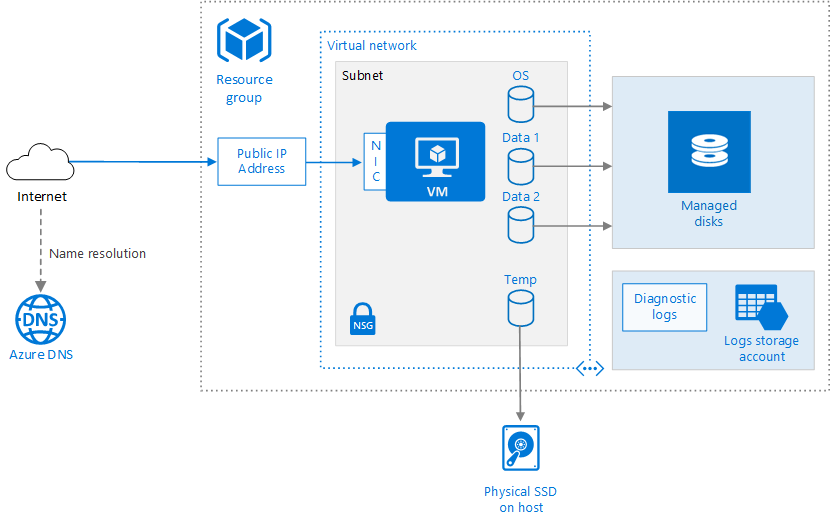
A virtual machine is a slice of a physical server rented out to you as if it were your own computer. When you provision one on Azure, you choose:
- vCPUs — virtual CPU cores. More cores mean more things can run truly in parallel.
- RAM — working memory. Every running program needs RAM; when it runs out, the system either kills processes or starts "swapping" (more on that below).
- Disk — persistent storage, separate from RAM. Filling this up has very different consequences from filling up RAM.
- A public IP — how the outside world reaches your VM.
My VM started as a Standard_D2als_v7: 2 vCPUs, 4 GiB RAM. That size matters a lot to everything that follows.
Problem 1: The disk filled up
The first symptom was simple — SSH would connect, print the welcome banner, and then just hang. No prompt, no error.
The cause was sitting right in the login banner the whole time: the root filesystem was at 100% usage.
When a Linux disk is completely full, even basic things like writing to log files or shell history can stall, which is often enough to freeze an interactive login. The fix was straightforward once identified: resize the disk in the Azure portal, then grow the partition and filesystem inside the OS to actually use the new space (growpart + resize2fs, or in my case, it turned out cloud-init handled this automatically on reboot).
Lesson: resizing a disk in the cloud portal only changes the virtual disk. The operating system still needs to be told to use the new space.
Problem 2: The CPU was pinned at 100%, and SSH kept dropping
With the disk fixed, a new problem appeared: SSH sessions would connect, let me run two or three commands, and then freeze or disconnect entirely.
The real culprit was a load average of 11 to 14 on a VM with only 2 CPU cores. Load average represents how many processes are competing for CPU time; a healthy number on a 2-core machine is under 2. Mine was five to seven times that.
Digging in with top and ps, two systemd services were the cause:
llama.service— running a local LLM (llama-server) with-t 2, using both CPU cores for inference.neet-rag.service— my FastAPI app, which was also loading an embedding model and doing PDF ingestion.
Both had Restart=on-failure, so even killing the processes manually just brought them back seconds later. The fix was disabling both services from auto-starting, applying Nice and CPUQuota limits so background work could never fully starve the system, and reducing the LLM to a single thread (-t 1) so one core stayed free for things like SSH.
Lesson: a process restarting automatically is a feature until it's fighting you for the only resource you need to log in and fix it.
Problem 3: Memory thrashing during first-time ingestion
Even after calming the CPU down, starting the RAG app for the first time caused the VM to grind to a halt again — this time from memory, not CPU.
free -h showed something telling: almost all RAM used, and gigabytes sitting in swap. Swap is disk space pretending to be RAM — useful as a safety net, but painfully slow compared to real memory, especially on a VM with a disk rated for only 50 MB/s. When a process needs memory faster than swap can deliver it, the system spends most of its time waiting on disk instead of doing real work. vmstat confirmed it: 17,000+ blocks per second being read back from swap.
The cause was a one-time, memory-heavy step: ingesting and embedding a 76 MB PDF textbook, all in a single pass, with an LLM server also competing for the same limited RAM.
The fix was two-fold: resize the VM to 8 GiB of RAM (Standard_D2as_v7), and run ingestion by itself, with the LLM server stopped, so the heaviest step had the whole machine to work with.
Lesson: a one-time startup cost (like building a search index) can need far more resources than the steady-state application ever will. Size for the peak, not the average — or isolate the peak so it doesn't take everything else down with it.
Problem 4: The index was being silently discarded
With resources under control, a new issue appeared: the app kept saying "no documents indexed," even though a valid, pre-built search index had been copied onto the VM.
The cause turned out to be a missing fingerprint file — a small file the app uses to check whether its saved index still matches the source PDFs. Without it, the app assumed the index couldn't be trusted and discarded it on every startup, even though the actual data was fine.
The fix was generating that fingerprint directly on the VM, using the app's own logic, so it would match what the app expected. A five-minute fix, once the actual cause was clear — most of the time was spent ruling out wrong theories first (bad PDF hash, wrong file paths, Git not syncing the files correctly).
Lesson: "it's using the wrong data" and "it's not using the data at all" look identical from the outside. Always check what the application logs at startup, not just what it does when you ask it a question.
What I'd tell someone starting this project fresh
- Separate heavy, one-time work from your steady-state app. Don't let model loading, ingestion, or indexing compete with the thing serving real requests.
- Watch
load averageandfree -hlike a dashboard, not just when something breaks. On a small VM, both get into trouble fast. - Auto-restarting services need limits.
Restart=on-failurewithoutNice/CPUQuotacan turn one slow process into a VM-wide outage. - A cloud portal change (resize, disk, network rule) is only half the fix. The OS almost always needs a corresponding step inside the VM.
- When something silently "doesn't work," check the startup logs first. Most of my mysteries weren't mysterious once I read what the app printed in its first five seconds of life.
None of this was glamorous. But it's the kind of debugging that actually teaches you how the layers underneath your application behave — and that's worth writing down.